Site logo.
Host Complete mockup.

Host Complete

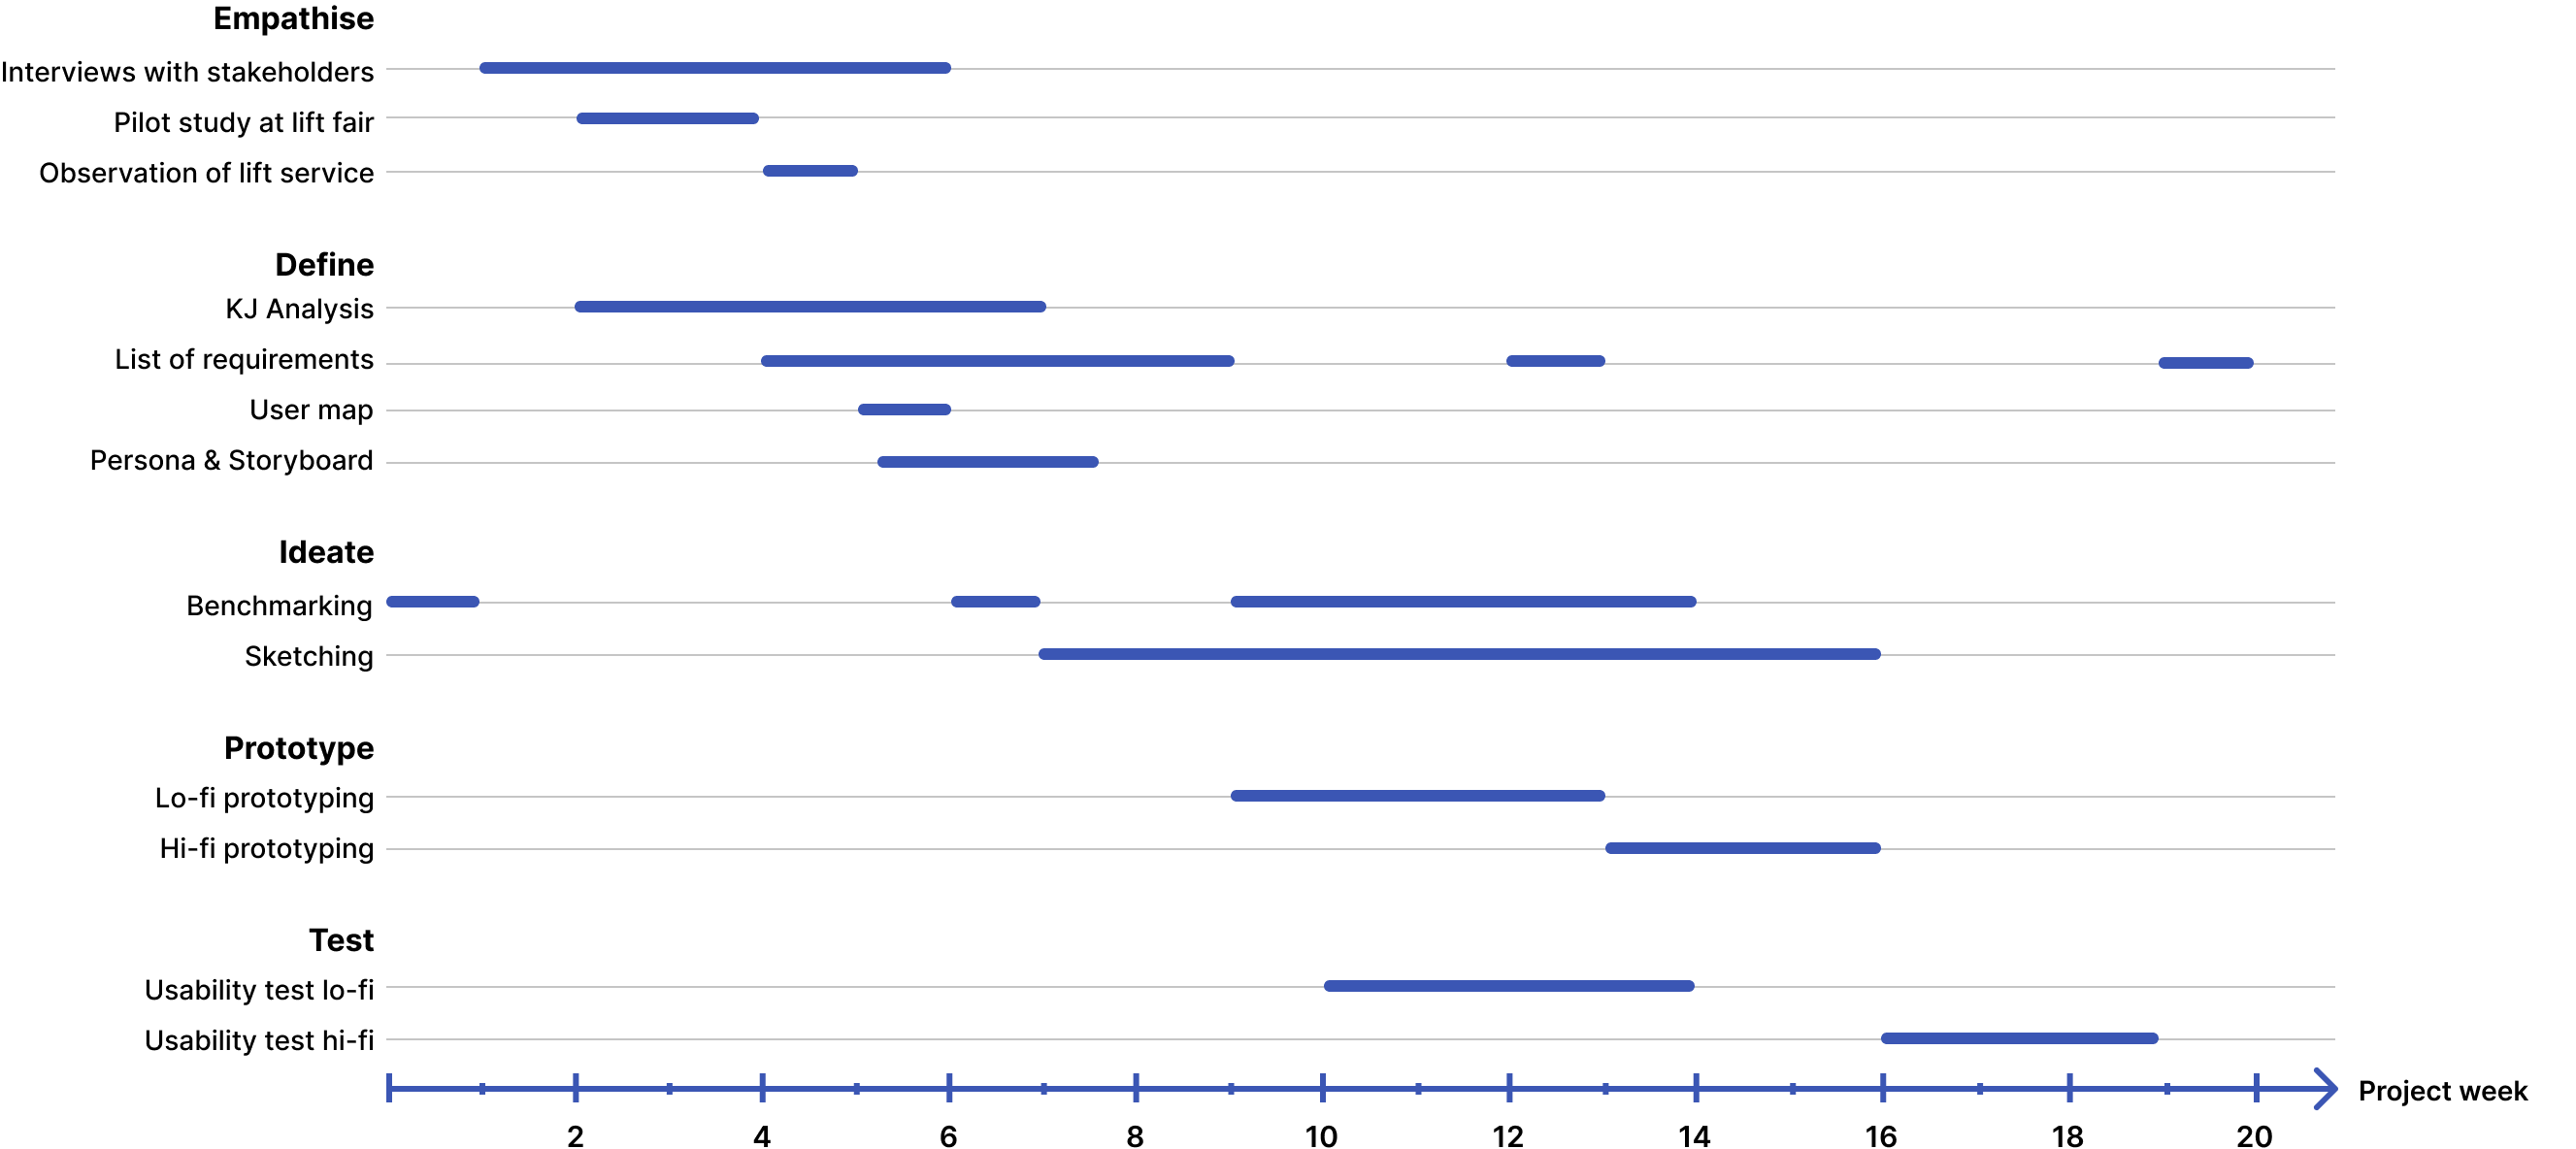
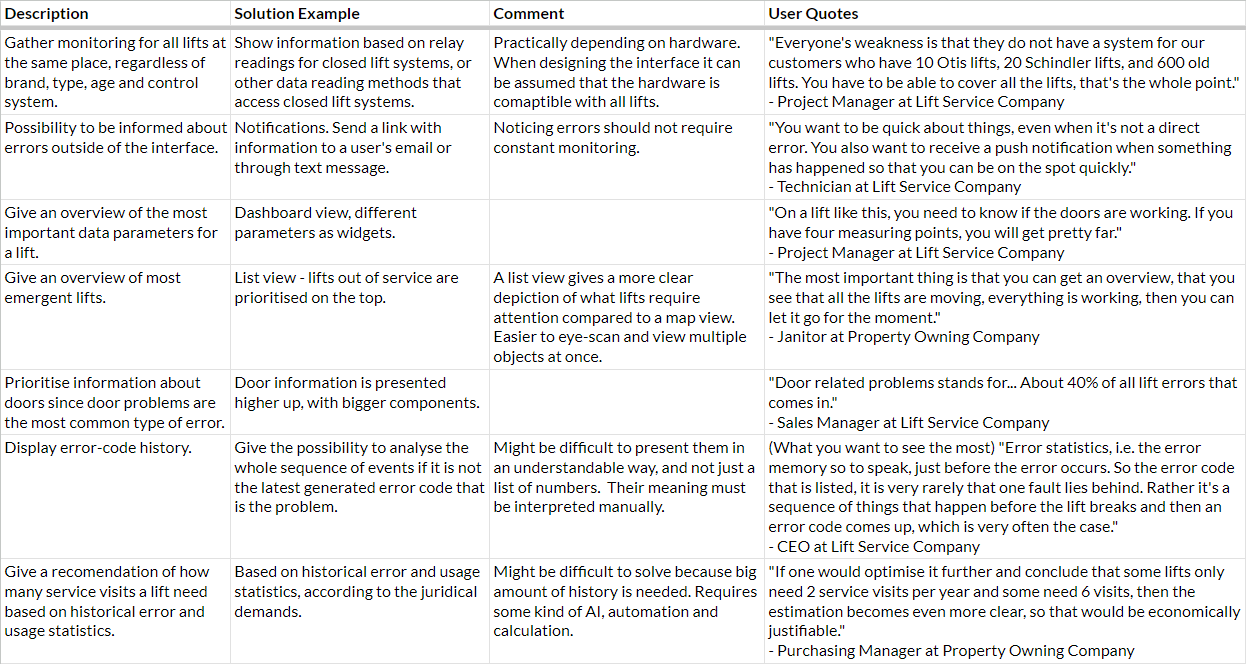
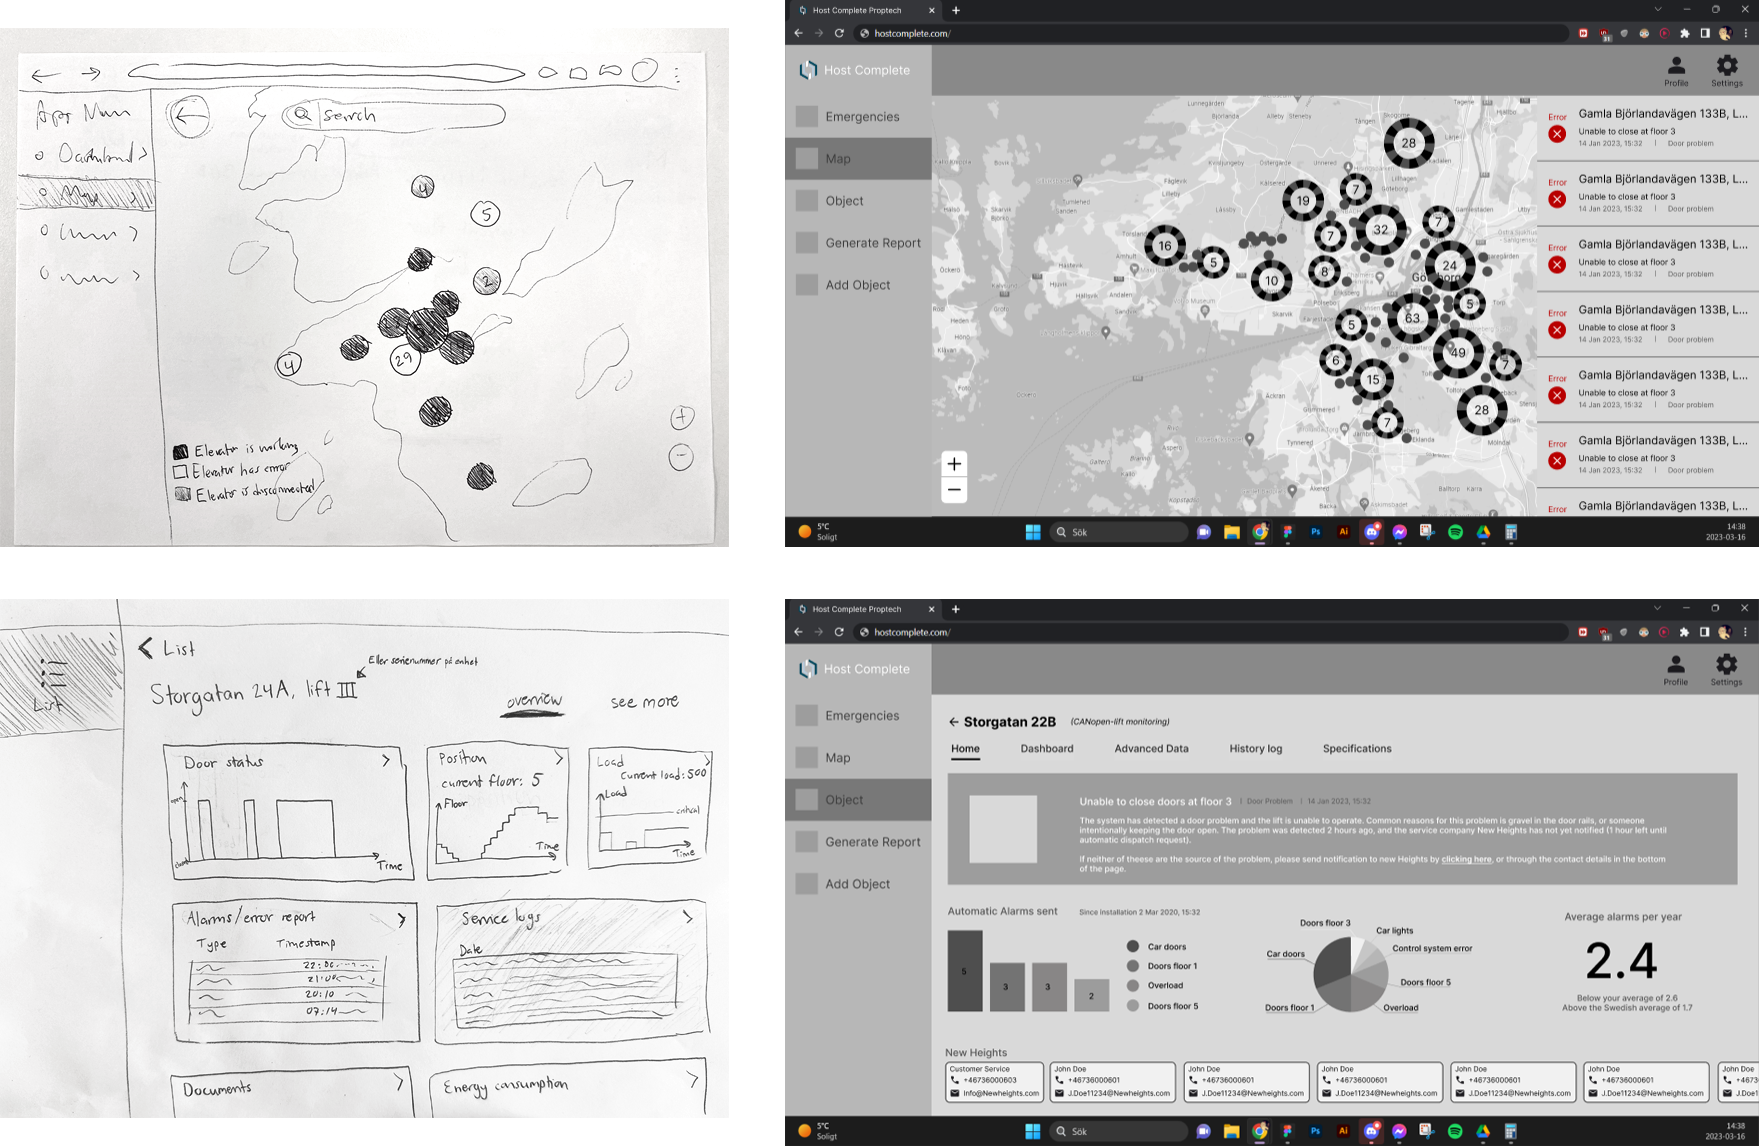
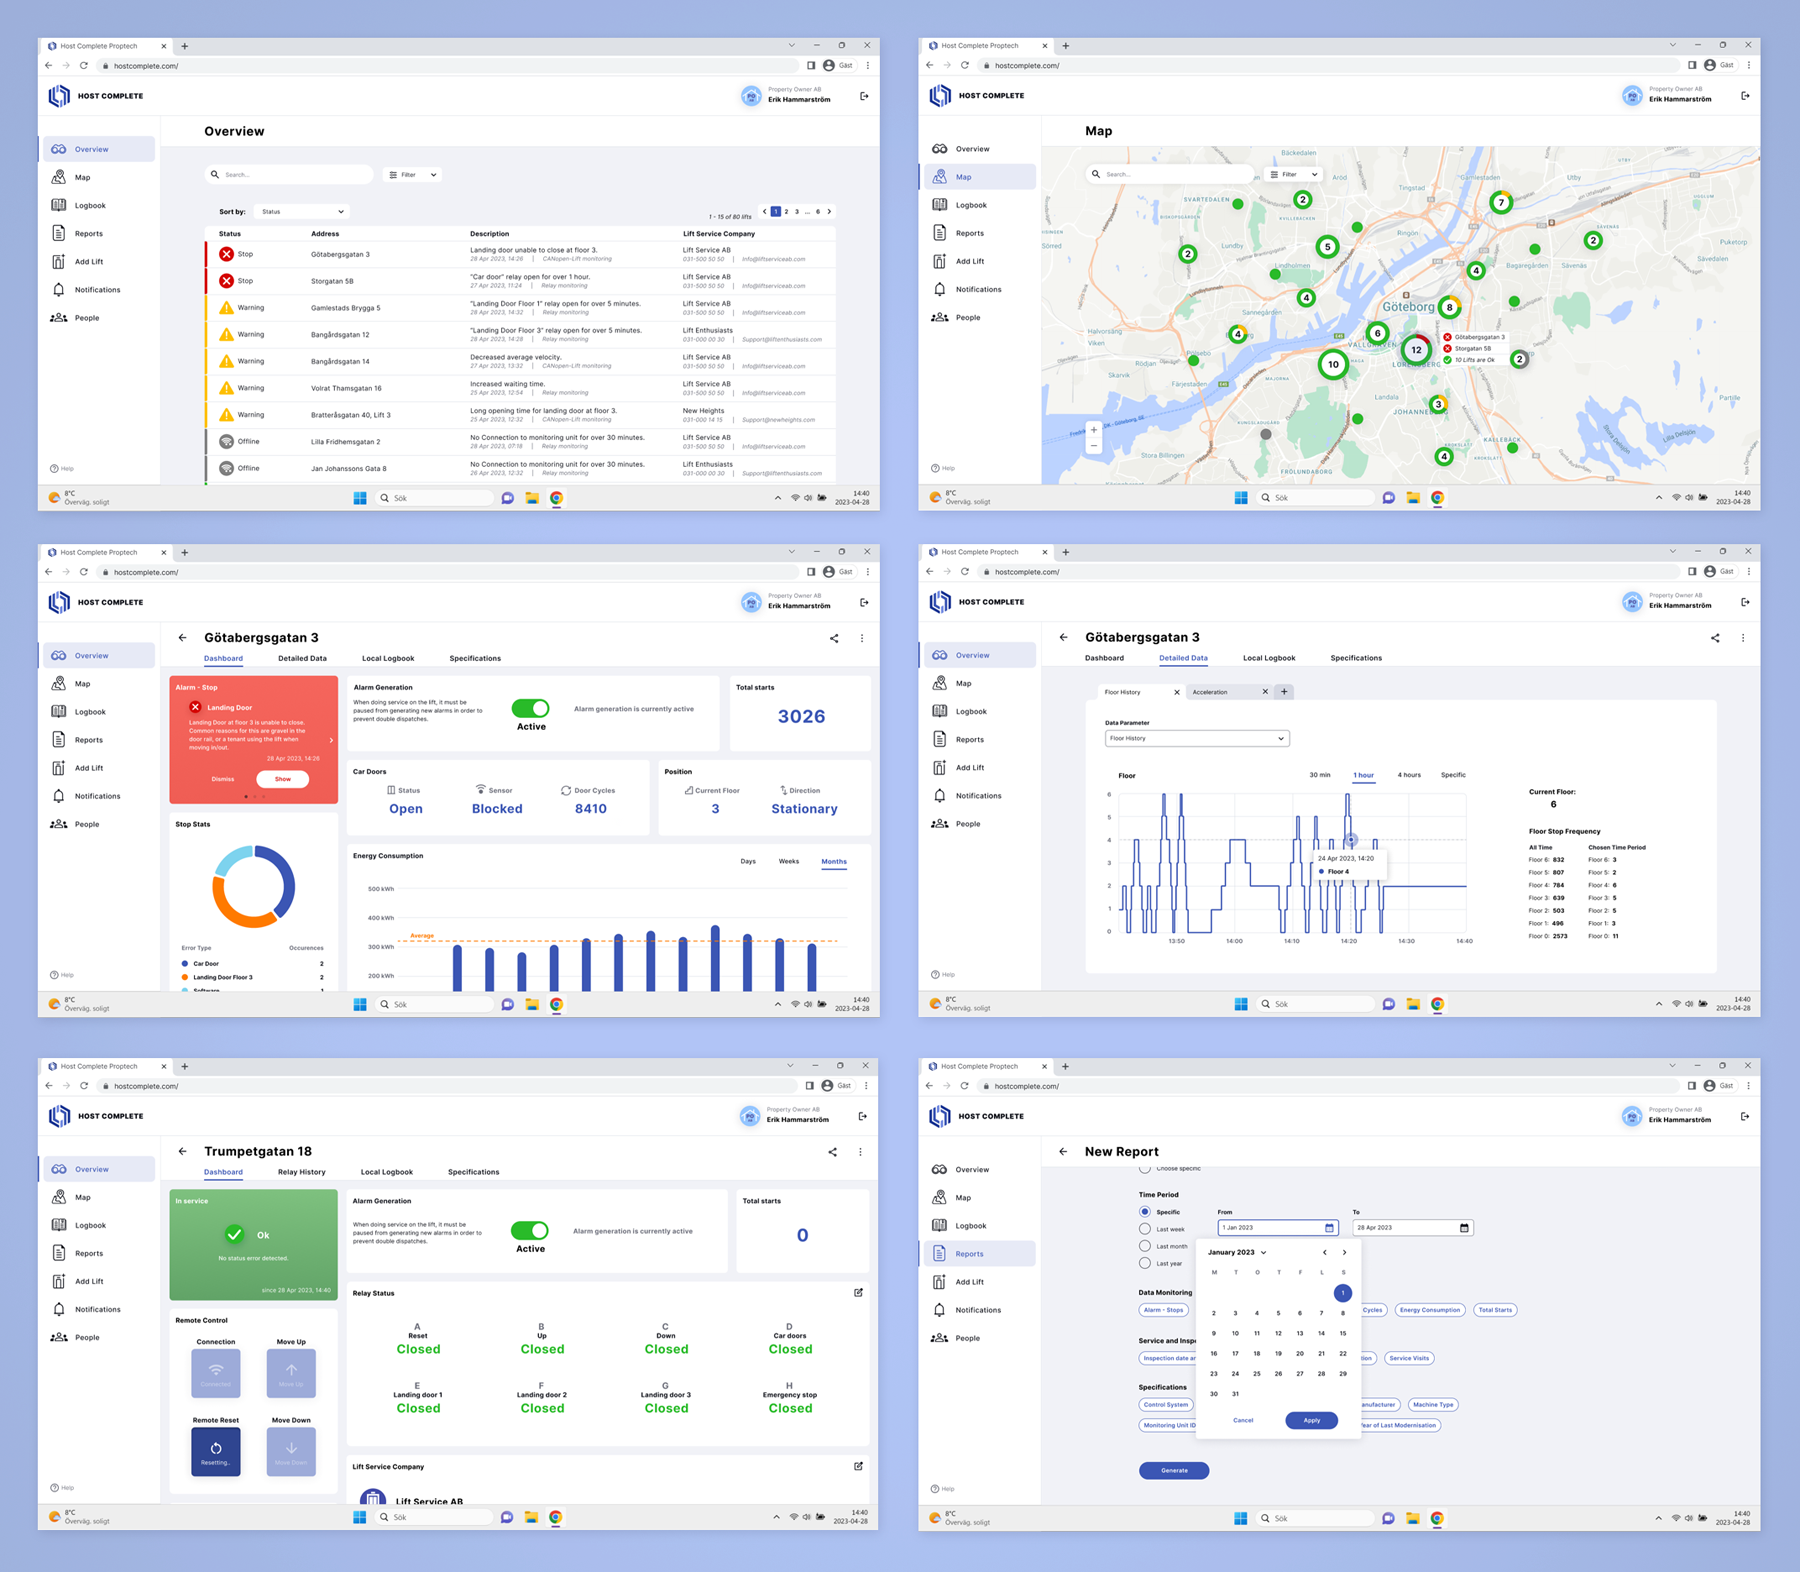
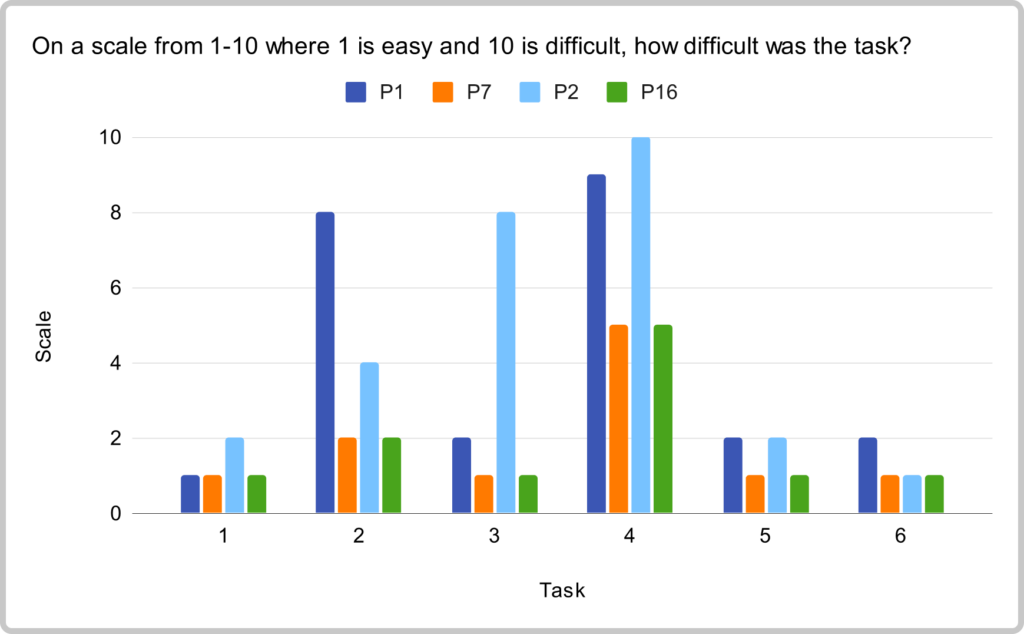
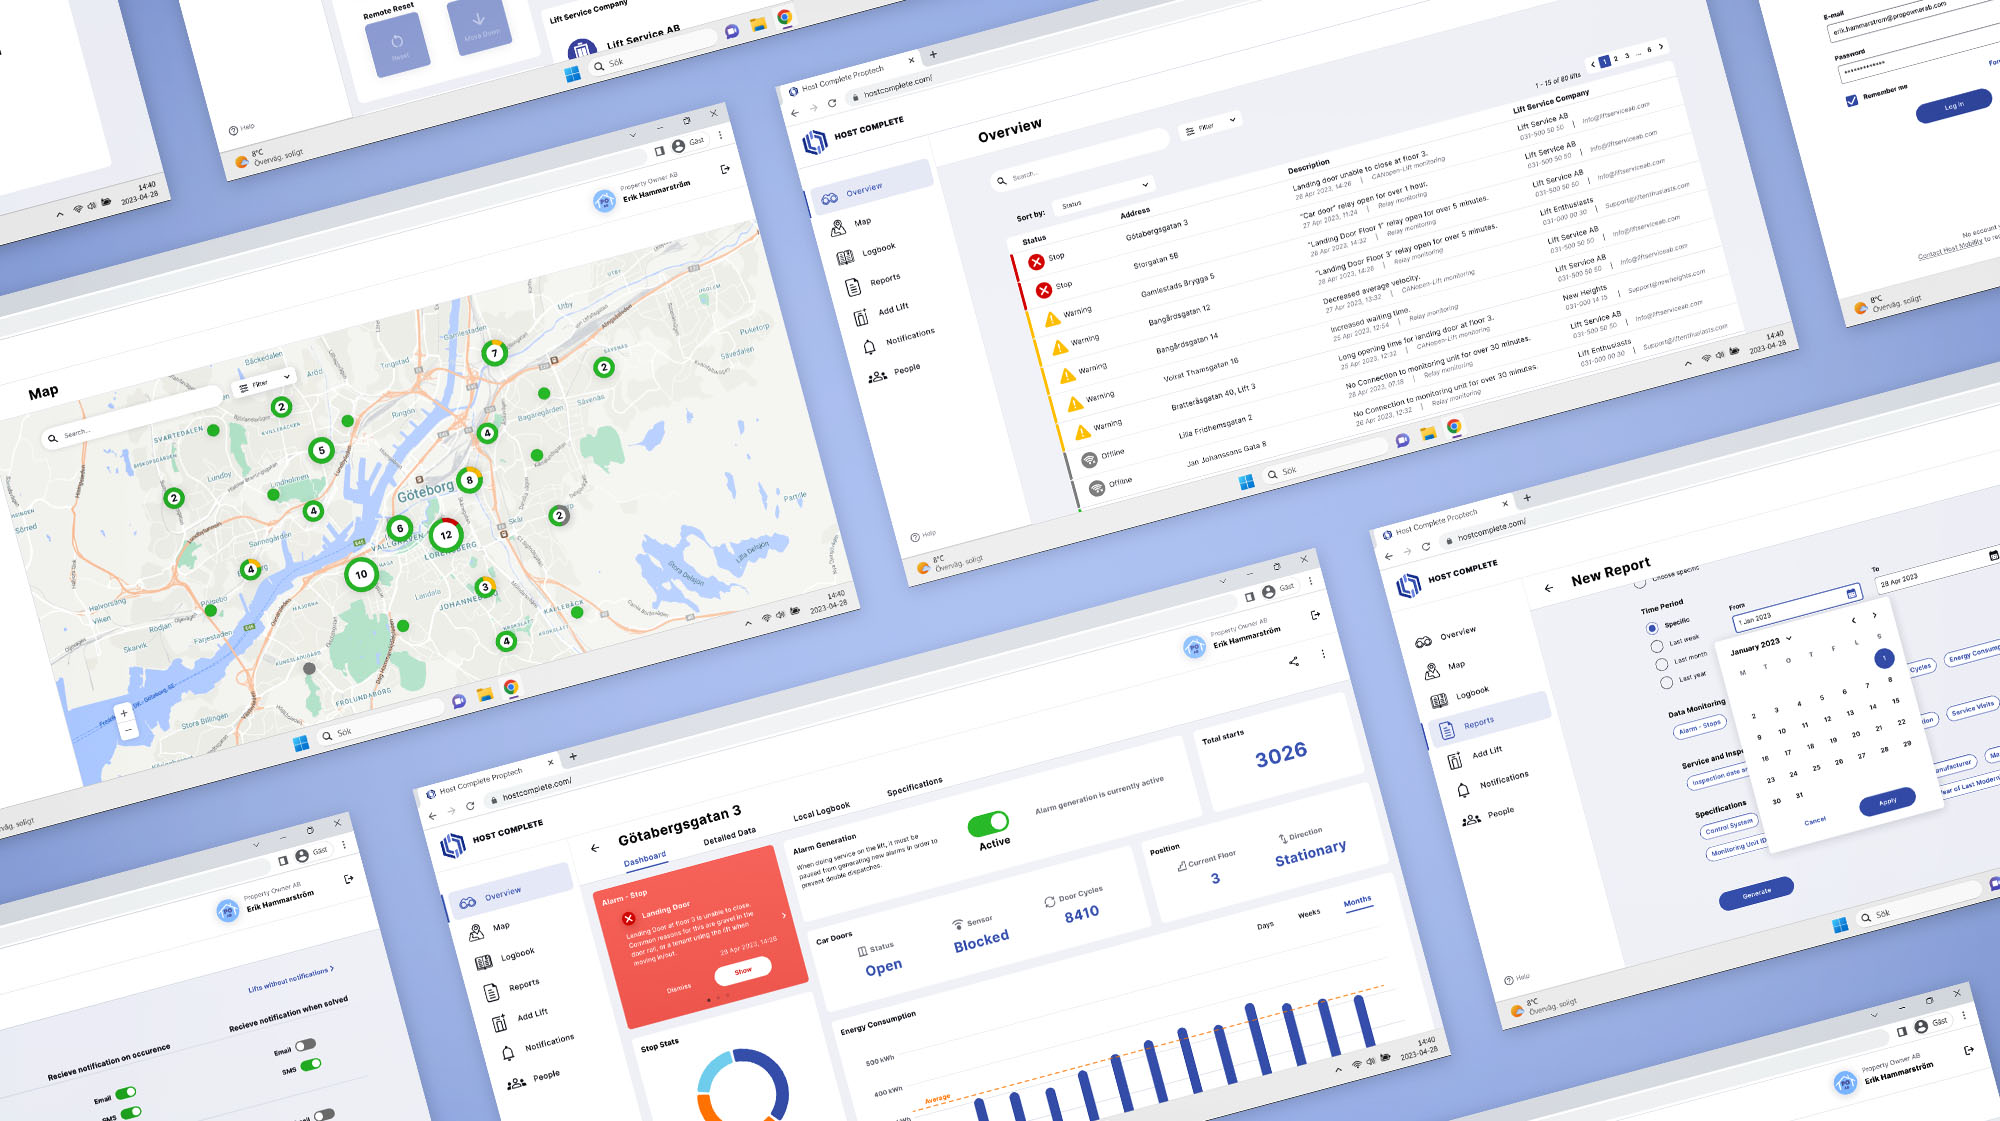
Design of a desktop web-based lift monitoring interface. This was my Master’s thesis project that I carried out together with Jonathan Boström for the company called Host Mobility. The field of property technology is increasing, allowing optimising, monitoring and maximising efficiency for different parts of the property, but the lifts have fallen behind in the digitalisation of properties. During the master thesis, we researched the needs and requirements for property owners and lift service companies when it comes to a lift monitoring system. We did UX and UI design of the interface to fulfil the needs.


The full Master’s thesis can be found [Here]

Type of project
Master’s thesis project

When

Jan 2023 – June 2023

Teammate

Jonathan Boström

Methods

Interviews, observation, KJ-analysis, list of requirements, storyboards, prototyping, usability testing

Background

In today’s society lifts are essential for allowing accessibility in apartment buildings, workplaces and other public buildings. While they create freedom through allowing transportation of large and heavy objects and people who can not move in stairs, they have high safety requirements. Maintenance must be done regularly in order to ensure safe operation. Responsibility lies on the Lift Service Companies, who work with maintenance and repairment of lifts.


The field of property technology increasing. However, the lifts have fallen behind in the digitalisation of properties. There are few solutions on the market that do track data from lifts and they all have their limitations. Some systems are not able to monitor all lifts, others do not collect enough information to be useful. There is a lack of solutions for lifts available on the open market. Property owners usually have many properties, including different lifts from different manufacturers, and different years of installation. This creates a problem of not being able to monitor all lifts in one place.


Data gathering of lifts enable proactive service and lead to clearer communication between the property owner and the lift service company. The Property owner could have a better overview of their lifts while the lift service companies could possibly troubleshoot quicker and work more efficiently. However, the data must be presented in a relevant way in order to be valuable for different users.

Project Process

The project followed the Design Thinking process, where we worked iteratively and divided activities into the different phases, Empathise, Define, Ideate, Prototype, and Test. Several activities were performed iteratively in order to refine and improve. Activities in a later phase gave insights that sparked new ideas and alterations of results and activities in previous phases.

Host Complete project's time distribution

Empathise

The phase Emphasise was about empathising with users, understanding the current situation and needs from the different stakeholders. This was done by gathering data about users’ needs, opinions, and stories. During the first phase we had three main activities to do so, the Nordic Lift Expo, interviews and an observation.

Nordic Lift Expo 2023

We visited the Nordic Lift Expo 2023. The annual fair where actors within the lift industry present their work, and connect for future partnerships. It helped us getting an overview of the market, meet actors, and sneak peek on other systems.

lift icon

Interviews

We did 12 interviews with 16 participants, having a variety of professions from both property owning companies and lift service companies. Focus was to learn more about how repairing a lift works, and what their needs are in a lift monitoring system.

interview icon

Observation of repairmen

To better understand technicians’ behaviour and workflow we shadowed them while demonstrating and explaining how it is done. It was important to see the real environment, in the right context, with the right tools.

observe icon

Define

The phase Define was about defining and concretising the problems that stakeholders expressed during the previous phase. This was done by defining who are the actual users of the lift monitoring system, analysing the gathered data and creating a list of requirements, stating what should be fulfilled in order to create value for users.

Personas and storyboards

Personas and storyboards were created in order to empathise with an archetypical user. They were based on the profiles of the interviewees. Several personas were made in order to cover the different stakeholders that could possibly make use of the lift monitoring system, including technical manager, janitor, lift consultant and technician. In this portfolio, the persona and storyboard for the technician can be seen below.

Persona of a lift technician. A 30 year old man who is interested in technology but dislikes customers just expecting everything to work.

Before lift monitoring system:

Host complete storyboard of technician before Host Complete solution

After lift monitoring system:

Host complete storyboard of technician after Host Complete solution

KJ Analysis

KJ analysis was done in order to analyse and get an overview of the data. All interviews were transcribed and interesting quotes were highlighted. All quotes were written down on sticky-notes in Figma, with a comment about who said it and from what interview. Similar quotes were placed next to each other. As quotes were being reorganised, clusters of sticky-notes started to form. Every cluster was given a name, describing the common meaning or insight from all sticky-notes. This was done over many iterations, reaching higher level of abstraction each time, giving clusters category names that described their topics. 

KJ Analysis of Host complete, showing different insights and quotes from interviews.

List of Requirements

A list of requirements was created to turn insight into desirable features that the monitoring interface should have. The whole list resulted in 78 requirements. Some of them can be seen below.

A list of a small selection of all requirements for Host Complete.

Ideate and Prototype

The ideation process began by doing paper sketches of different frames of the prototype. At this stage of the process, it was important to be explorative and come up with as many ideas as possible. Sketching the same screen multiple times allowed variation changes and refinements each time. 


A lo-fi prototype of the lift monitoring interface was created in Figma. Focus was on function, navigation and layout rather than aesthetics. The goal was to find proper placement of elements and components, and getting the right information in the right place. The prototype was made in greyscale with a few colours to represent status indication, for example red for error and green for okay. It was made rough intentionally  to steer away focus from the details. Early sketches and screens from the lo-fi prototype can be seen below.

Host Complete lo-fi prototyping, including simple paper sketches and black and white wireframes in Figma.

Test

Formative evaluations was done over many iterations in order to receive qualitative feedback, refine the lo-fi prototype and make it as easy to use as possible. It was evaluated through usability tests. The tests were done with two friends, five employees at Host Mobility, and two Lift Service Company employees. 


Participants were supposed to complete a set of tasks in the prototype that were supposed to imitate real life situations. After all tasks were completed they were asked general, open-ended questions about the interface, for example what they liked and what could be improved. It was valuable to continuously receive feedback, and easier to implement changes while the prototype was still in an early stage. Some flaws that were discovered, and changes that were implemented at this phase was: 


  • Inconvenient with two passwords required for login. We removed profile-login.
  • Map view does not have a search function. Difficult to find what you are looking for which leads to a lot of clicking. Therefore we added a search bar and made objects hoverable.
  • The tab “Object” did not meet users expectations. The tab was removed.
 

These tests worked as a basis for the next round of tests which was done with the hi-fi prototype.


Result - The final prototype of Host Complete

The project resulted in a final prototype of a web based lift monitoring application called Host Complete. For this project, only the desktop version was designed. The interface has been designed to fulfil both property owners and lift service companies. It allows users to get an overview of their lifts as well as providing detailed information about specific data parameters.  

Host Complete selected screens of the hi-fi prototype created in Figma.

Final Evaluation of Host Complete

A final evaluation of Host Complete was done through usability testing with real stakeholders. There were four participants, a property developer (P1), a technical manager (P7), a lift consultant (P2) and a technician (P16). Two versions of the interface were created, depending on if the user worked for a property owning company or a lift company. 


Each participant tested one of the versions according to their profession. As mentioned previously we did summative usability tests with stakeholders. Participants were supposed to complete a set of tasks in the prototype, then after completing each task they were asked to scale how difficult they thought it was. After completing all tasks participants scaled their overall experience with the prototype through a semantic differential.


In total there were 17 tasks that the participants performed. Some of them were for property owners only, some tasks were for lift experts only. The reason they had different tasks was that they were assumed to use the interface in slightly different ways. The tasks were as follows:

Tasks for everyone

1. Find out what is wrong with a lift.

2. Find what a certain monitoring unit type means.

3. Find how many yearly service visits are recommended by the system and what it is based on.

4. Find out which floors the lift stops at the most and the least.

5. Find out what year the lift was built, and last modernised.

6. Change notification settings.

Tasks for property owners

7. Find the energy consumption for a lift.

8. Find out what was done during the last service visit.

9. Generate a report with given properties.

10. Find out which elevator was the most expensive according to the report.

11. Transfer lifts to another lift service company.

Tasks for lift service companies

12. Find what error codes caused the last alarm. 

13. Find out what floor the elevator last stopped at before the current stop. 

14. Pause a lift from generating alarms. 15. Add a new service log. 

16. Add a new lift. 

17. Control the lift remotely.

Participants’ percieved difficulty of the tasks and their semantic differential scaling can be seen in the images below.

All participants' perceived level of difficulty for the tasks performed. Out of six tasks, three tasks were easy, two tasks shows that they were somewhat more difficult than the other tasks, and one task was clearly more difficult.
Property owners perceived level of difficulty for the property owner oriented tasks only. All five tasks were perceived as easy, except two tasks that were extra difficult for P1.
Lift experts' perceived level of difficulty for the lift expert oriented tasks only. All six tasks were perceived as easy.
Results from participants' rating their experience of using Host Complete in a semantic differential.

Reflection

This master thesis project was quite extensive, designing a lift monitoring interface from scratch, based on the identified needs from property owners and lift service companies. The two parties had quite different needs, often conflicting. Despite this challenge, tests and feedback have been mainly positive, showing that most tasks were easy to perform. 


The tasks that were perceived as difficult required users to dig deeper in the information hierarchy, being more “hidden”. Participants commented that once they found the information it was very easy to perform the task and understand that it was completed. However, it is always desirable to make the interface as easy to use as possible for users, including novice users. More iterations on some parts would be beneficial for optimised information visualisation.


Filling the interface with reliable and realistic content required us as designers to immerse ourselves in the world of lifts, which have been interesting, exciting and unpredictable. The identified requirements in combination with Host Complete serves as a stepping stone for future development in the field of lift monitoring systems and contribute to ongoing advancement in Property Technology.